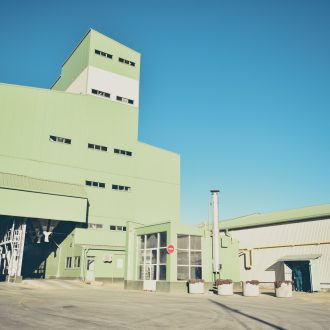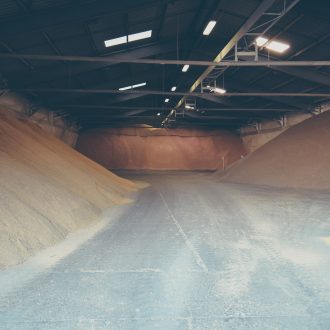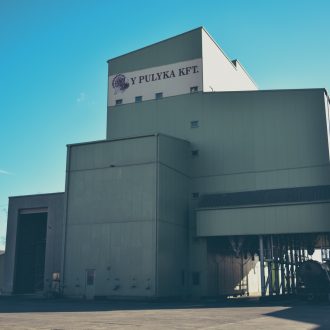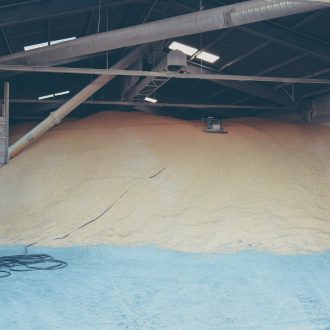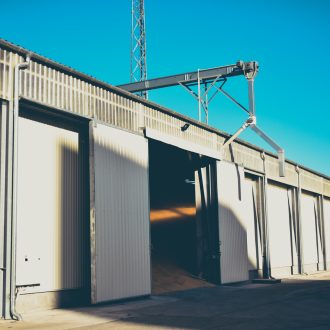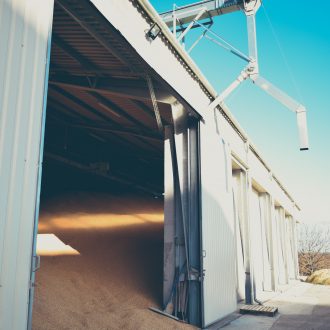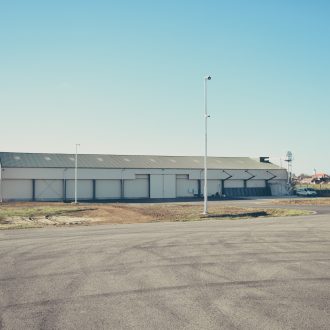

Y Takarmányipari Ltd. The Y Takarmányipari Ltd. is a member of the Y Corporate Group, and it is responsible for producing safe feed for poultry farming. Realising the importance of quality feed, we used to outsource the production of feed using our own recipe by contract manufacturing. After purchasing the feed-mill in Mágocs we united the manufacturers’ farming technology with the ingredients of the feed. We were then able to reduce the amount of feed needed for the poultry to gain 1 kg. The market price of the feed also got less dependent from the seasonal changes of the ingredients. Y Takarmányipari Ltd. The feed-mill of Y Takarmányipari Ltd. has ISO 22000 classification. It significantly increases the safety of feed production (possibility of monitoring). The capacity of our feed-mill has expanded since we purchased it in 2006 – thanks to the development in 2014 the capacity has increased to 15t/h. This means that the feed-mill is able to produce 85-90.000 ton of feed yearly, if it works on maximum capacity. Our company produces 6 types of turkey feed, 4 types of chicken feed and since 2018, 5 types of pig feed, to provide to the slaughterhouses with excellent quality meat
In 2020, another investment was finished, as a result of which the nominal capacity of the mixing plant was increased to 20 t/h, which enables the production of approximately 125.000 tons of feed on an annual basis. We transport 90-95% of the finished feed to farmers using our own vehicles owned by Y Takarmányipari Ltd. The continuous development has resulted in further changes in our company. Since we have our feed-mill we follow the latest developments by geneticists, in order to determine the most effective composition of our feed.


